While working in his garden, in the late 1890s, Vilfredo Pareto discovered that most of the production of his peas came from the minority of plants. A small but curious discovery that he could not help but extrapolate to his areas of work: Mathematics and economics.
At that time, Vilfredo Pareto was conducting studies on the distribution of land in Italy and was hired by neighboring countries to study economic statistics, and it was then that he began to see the same proportion that he noticed in his garden, applied to many aspects of life:
- 80% of Italian land belonged to 20% of the population.
- More than 70% of Britain's economic income was earned by less than 30% of the population.
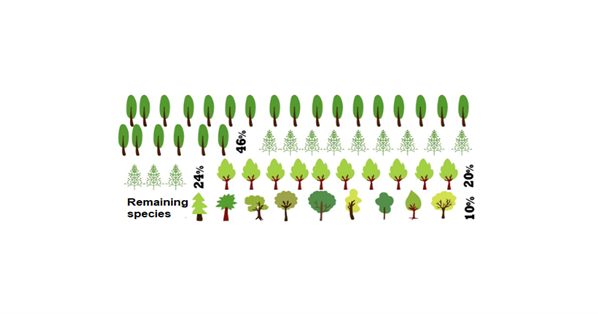
- In the forests of the Amazon, 90% of the trees belong to 10% of the species.
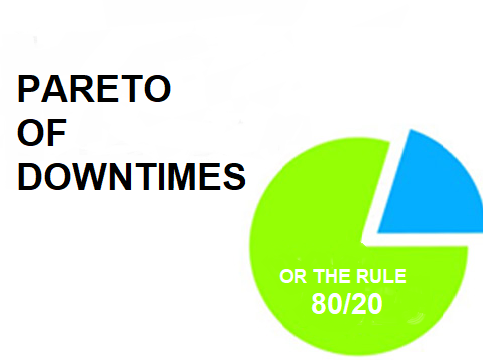
These data led Joseph M. Juran to postulate the "Pareto Principle" or the "80/20" law, published in 1896 in the article "Cours d'économie politique", where it is mathematically established that 80% of the results are due to 20% of the causes.
A very strong law in the current context that can be adapted to a Pareto of Downtimes.
Following Vilfredo Pareto's guidelines, we study the reasons why there are production stoppages in plants and factories and compare them with the cumulative time of these stoppages. The results are as clear now as they were 150 years age:
- There are X number of reasons for a machine to be stopped without producing.
- The machine will spend AND time without producing.
- 20% of the motifs will cause 80% of the machine's downtime.
The Pareto of Downtimes is an analysis of this information, which will reveal what conditions need to be improved to minimize machine idle times.
Let’s analyze a soccer ball machine:
- It has a production capacity of 100 soccer balls per hour and operates 24 hours a day.
- The sale of these balls generates a profit of $1,000 each.
- The machine can produce 2,400 balls daily and generate a profit of $2,400,000 per day.
- Annually, it can produce 876,000 balls and generate $876,000,000 in profit.
- Annually, the machine is idle for 760 hours.
- Annually, 76,000 balls were not produced, resulting in a loss of $76,000,000.
When computing how many hours the machine was stopped for each reason, it is revealed that 380 hours are for "Material Change 3" (50% of the downtime) and 228 hours for "Engine Cooling" (30% of the downtime). The other 8 reasons totaled 152 hours between them and are: change of material 1, change of material 2, change of operator, minor breakdown, serious breakdown, preventive maintenance, production review and cleaning.
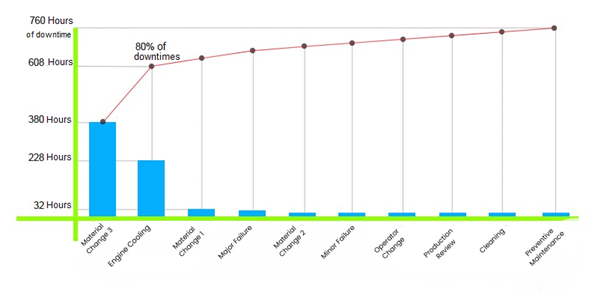
20% of the causes of stoppage caused 80% of the downtime and directly impacted the production and profit capacity of the balloon company.
What the Pareto de Paradas representation allows is to identify the downtime with the greatest impact and generate plans to turn those losses into opportunities. In this way, attention can be focused on the most important causes and 80% of the problem can be attacked.
Initially, the causes of stoppage should be few to carry out a more objective analysis. Also, when you identify a cause of shutdown that is taking up a lot of time, it should be broken down into minor causes so that you can find more specific issues.

If you want to receive articles like this by email, sign up! Click Here.
We invite you to watch the video on how our GESPLINE platform works: Click Here!